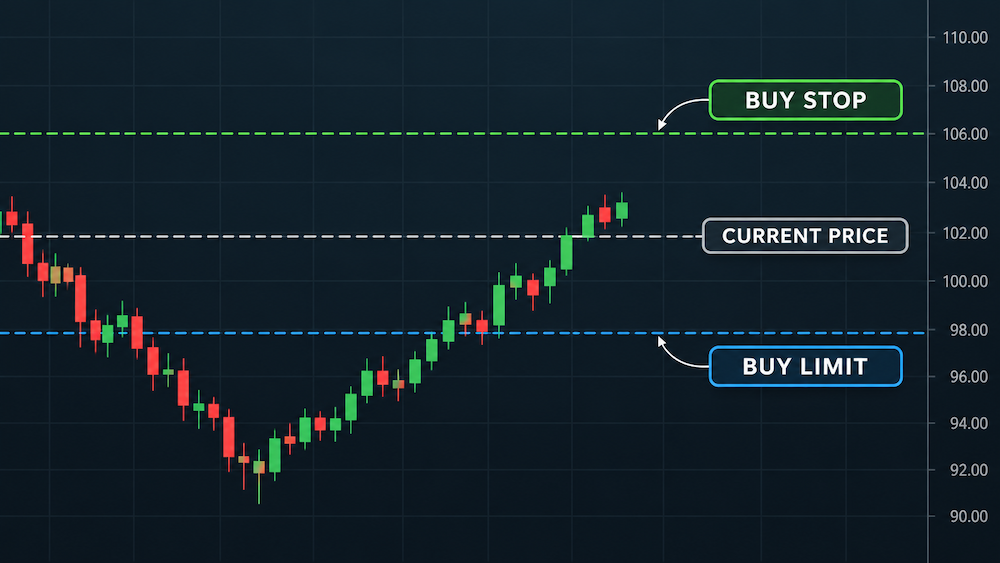


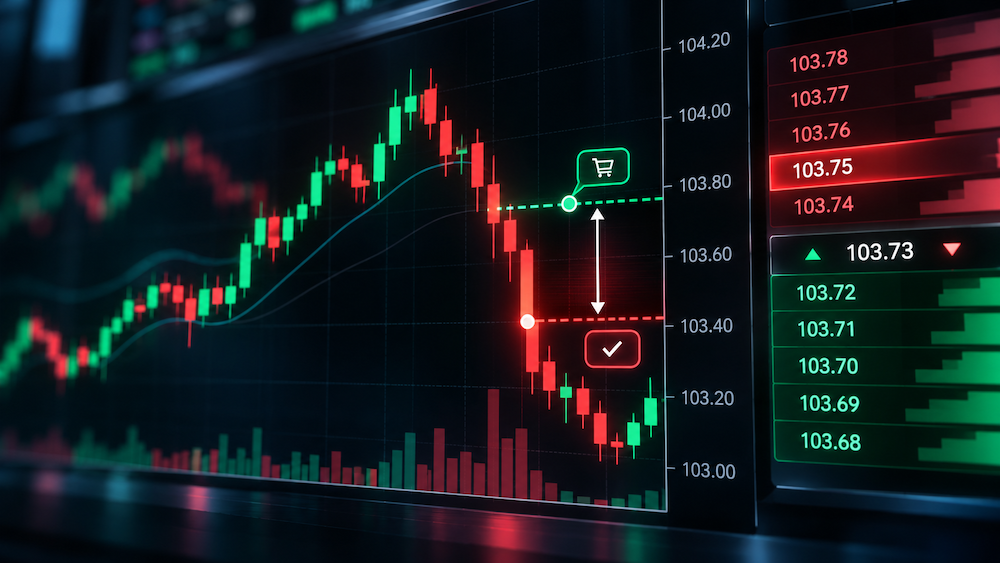
Slippage in trading occurs when an order executes at a different price from the one a trader expected. Even a small difference can affect trading costs, potential profits and risk management. While slippage is often associated with volatile markets, it can also occur during ordinary trading conditions. Understanding how liquidity, volatility, order size and execution speed influence the final price is essential for anyone trading forex, stocks or cryptocurrencies.
What Is Slippage in Trading?
Imagine watching a stock trade at $50 per share. You decide to buy 100 shares and submit a market order. However, when the transaction is completed, your broker confirms an execution price of $50.10.
Instead of paying the expected $5,000, you have spent $5,010. The additional $10 represents the difference between the expected and executed transaction values.
This is a simple illustration of slippage in trading.
The concept applies to virtually every financial market, including stocks, foreign exchange, cryptocurrencies, commodities and derivatives.
Slippage occurs because the price displayed on a trading platform is not necessarily the price available when an order reaches the market.
Financial markets constantly process new orders, cancellations and transactions. As a result, the available buying and selling prices can change within fractions of a second.
The US Securities and Exchange Commission (SEC) explains in its investor guidance on order types that market orders generally execute promptly, but their execution prices are not guaranteed.
Importantly, slippage does not always work against the trader. Depending on market conditions, an order can also execute at a more favorable price than expected.
Why Does Slippage Happen?
Several interconnected factors determine whether a trading order executes at the expected price. The most important are market liquidity, volatility, order size and execution speed.
1. Market liquidity: Why available buyers and sellers matter
Liquidity describes how easily an asset can be bought or sold without significantly affecting its market price.
Highly liquid markets generally have numerous buyers and sellers placing orders at different price levels. This makes it easier to execute transactions close to the prevailing market price.
For example, a heavily traded stock may have thousands of shares available near the current quoted price. A relatively small market order can therefore be executed without moving far through the available prices.
By contrast, an illiquid stock or cryptocurrency may have very few orders available at its best quoted price.
If a trader attempts to purchase more units than are available at that price, the remaining quantity must be matched with sellers offering higher prices.
The resulting average execution price can be worse than expected.
This relationship between market depth and execution costs is particularly important in cryptocurrency markets, where liquidity can differ significantly between exchanges and individual trading pairs.
2. Market volatility: When prices move faster than orders
Volatility measures how quickly and significantly market prices fluctuate.
During periods of elevated volatility, prices can change substantially between the moment a trader submits an order and the moment it executes.
Consider a company publishing unexpectedly strong quarterly earnings. Investors may immediately rush to buy its shares, causing available selling prices to increase rapidly.
A trader who submits a market order based on an earlier quote may consequently pay more than anticipated.
Similar conditions can occur during central bank announcements, inflation reports, geopolitical developments or sudden cryptocurrency market movements.
However, volatility and slippage are not identical concepts. Volatility describes price fluctuations, while slippage measures the difference between an expected price and an actual execution price.
A volatile market with sufficient available liquidity can sometimes offer better execution than a relatively calm but extremely illiquid market.
3. Order size: Why larger trades can cost more
The size of an order directly influences its potential market impact.
Suppose a trader wants to buy 200 shares of a company. The order book currently contains the following selling interest:
| Available quantity | Selling price |
|---|---|
| 100 shares | $50.00 |
| 100 shares | $50.16 |
If the trader submits a market order for all 200 shares and these are the available prices, the transaction will be completed in two parts.
The first 100 shares cost $5,000, while the remaining 100 shares cost $5,016.
The total purchase price is therefore $10,016, representing an average execution price of $50.08.
Although the best available selling price was originally $50, the trader ultimately paid eight cents more per share on average.
This example demonstrates how a large order can consume liquidity at several price levels. Traders often refer to this process as walking the order book.
The larger an order is relative to the available market depth, the greater its potential price impact.
4. Execution speed: Why milliseconds can matter
Execution speed refers to the time required for a trading order to travel through the relevant systems and reach execution.
Even on modern electronic trading platforms, order execution is not necessarily instantaneous.
An order may pass through a broker’s infrastructure, risk checks, routing systems and a trading venue before being completed.
During that interval, the available market price may change.
The SEC emphasizes in its guide to trade execution that investors are not guaranteed the price displayed when they submit an order.
Faster execution may reduce exposure to price movements during processing, but speed alone cannot eliminate slippage. Even an immediately executed order can receive an unfavorable average price if insufficient liquidity is available at the best quote.
Read also: Forex trading for beginners: What to know before trading currencies
How to Calculate Slippage in Trading
The financial impact of slippage can be calculated using a straightforward formula.
For a buy order:
Slippage cost = (Execution price − Expected price) × Quantity
For a sell order:
Slippage cost = (Expected price − Execution price) × Quantity
Under these formulas, a positive result represents an unfavorable execution cost, while a negative result represents a favorable price improvement.
To express the difference as a percentage:
Slippage (%) = (Slippage cost ÷ Expected transaction value) × 100
The expected transaction value equals the expected price multiplied by the quantity.
For orders completed through multiple transactions, traders should use the volume-weighted average execution price rather than the price of only the first fill.
One important distinction concerns the reference price. The last traded price shown on a chart may differ from the price at which an investor could immediately buy or sell. For a more meaningful execution-quality comparison, buyers should generally compare their fills with the relevant available ask price and sellers with the bid price at order submission.
Otherwise, the calculation can mistakenly include part of the bid-ask spread as apparent slippage.
Slippage Examples in Forex, Stocks and Crypto
Although the underlying principle is similar across financial markets, the way slippage affects a transaction depends on the asset and trading structure.
The following examples use hypothetical prices for illustration, not live market quotations.
Forex: A three-pip difference in EUR/USD
Suppose a forex trader places a market order to buy 100,000 euros against the US dollar.
The expected execution price is EUR/USD 1.1000, but the actual fill occurs at 1.1003.
The difference is 0.0003, equivalent to three pips.
Slippage cost = (1.1003 − 1.1000) × 100,000 = $30
The trader pays an additional $30 because of the unfavorable execution.
For a smaller trade of 10,000 euros under identical conditions, the additional cost would be $3.
This demonstrates why position size matters when evaluating execution costs.
Forex slippage can become particularly noticeable around major economic announcements or periods of reduced liquidity.
The US National Futures Association discusses forex execution differences and broker handling of price changes in its Forex Transactions Regulatory Guide.
Stocks: A small price difference adds up
Imagine an investor placing a market order to purchase 200 shares.
The expected ask price is $50.00, but the transaction executes at an average price of $50.08.
Slippage cost = ($50.08 − $50.00) × 200 = $16
The additional cost may appear insignificant compared with the total investment.
However, for an active trader executing many transactions, repeated differences between expected and actual prices can meaningfully reduce trading performance.
The effect may be especially relevant for strategies targeting relatively small profits per transaction.
Crypto: Slippage during a Bitcoin purchase
Cryptocurrency markets operate continuously, but liquidity and trading conditions can differ substantially across platforms.
Suppose Bitcoin is available at an expected price of $70,000, and a trader places a market order to purchase one BTC.
Due to changing available prices or insufficient liquidity at the expected level, the order executes at an average price of $70,210.
Slippage cost = ($70,210 − $70,000) × 1 = $210
The percentage cost is:
Slippage = ($210 ÷ $70,000) × 100 = 0.30%
A 0.30% difference may not seem substantial, but it becomes meaningful when transactions are repeated or when a strategy operates with narrow expected profit margins.
Crypto exchange Coinbase explains in its slippage guidance that liquidity and trading activity influence the difference between expected and actual execution prices.
Comparing the three examples
| Market | Expected price | Execution price | Slippage cost |
|---|---|---|---|
| Forex: 100,000 EUR/USD | 1.1000 | 1.1003 | $30 |
| Stocks: 200 shares | $50.00 | $50.08 | $16 |
| Crypto: 1 BTC | $70,000 | $70,210 | $210 |
All three examples demonstrate unfavorable slippage. Actual execution can also be more favorable than the reference price, and the examples exclude commissions and other transaction charges.
Positive vs. Negative Slippage: Can Slippage Benefit Traders?
Slippage is frequently described as an additional trading expense, but this is not always accurate.
Unfavorable slippage occurs when a trader receives a worse execution price than expected. A buyer pays more, or a seller receives less.
Favorable slippage, sometimes called positive slippage or price improvement, occurs when a transaction executes at a better price than anticipated.
For example, an investor planning to buy shares at $100 might receive an execution price of $99.90.
For 100 shares, that improvement saves $10 relative to the original expectation.
Whether price improvement is available depends on market conditions, the execution venue, the broker’s routing practices and the order type.
A trader should therefore evaluate realized execution quality over many transactions rather than judging a platform from a single order.
Read also: Is day trading haram? Rules for Muslim investors
Slippage vs. Spread: What Is the Difference?
Slippage and the bid-ask spread are related trading concepts, but they represent different sources of transaction costs.
The spread is the difference between the highest available buying price, known as the bid, and the lowest available selling price, known as the ask.
For example, a stock might have a bid price of $49.98 and an ask price of $50.00.
The displayed spread is two cents.
An investor submitting a market buy order would generally expect to trade against the ask side, subject to available liquidity and execution conditions.
Slippage arises when the actual execution differs from the relevant expected price.
For instance, if the trader expects to buy at the available ask of $50.00 but receives an average fill of $50.08, the unfavorable difference is eight cents per share.
The spread, slippage and brokerage commissions can all contribute to trading costs, but they should not be treated as interchangeable.
How to Reduce Slippage in Trading
Slippage cannot always be avoided, but traders can take practical steps to manage their exposure.
Use limit orders when price certainty matters
A market order prioritizes execution at the available market price, while a limit order specifies the worst acceptable execution price.
A buy limit order at $50, for example, can execute at $50 or lower but not above that limit.
This prevents the order from executing at an unexpectedly higher price.
The trade-off is that the order may remain partially filled or not execute at all if the market moves away.
Limit orders therefore control execution prices rather than guaranteeing transactions.
Pay attention to market liquidity
Before placing a large trade, investors should consider the available trading volume, bid-ask spread and depth of the order book.
A narrow spread and substantial liquidity near the prevailing price generally provide a more favorable environment for execution.
However, displayed liquidity can change rapidly, and it does not represent a guarantee that orders will remain available.
Be cautious during major announcements
Economic reports, corporate earnings and unexpected market developments can trigger sudden price movements.
Traders who do not specifically need to participate in these events may reduce execution risk by avoiding periods of extreme volatility.
This does not mean that trading during volatile conditions is necessarily inappropriate. It means that the possibility of unfavorable fills should be reflected in position sizing and risk management.
Consider dividing large orders
Instead of executing one very large market order, traders may divide transactions into smaller portions.
This can reduce the amount of liquidity consumed at once and potentially limit immediate market impact.
However, splitting orders also creates other risks. Prices may move between executions, and completing the full position may become more difficult.
For larger transactions, execution methods such as time-weighted average price (TWAP) or volume-weighted average price (VWAP) strategies may help distribute trading activity over time.
Neither approach guarantees a better overall execution price.
Evaluate the quality of execution
Frequent traders should monitor the differences between the prices available when their orders were submitted and the prices they actually received.
A simple execution log can record the instrument, order size, reference bid or ask, execution price, time of execution and resulting slippage cost.
This helps reveal whether unfavorable execution is concentrated in particular assets, trading sessions, market conditions or order sizes.
Does a Stop-Loss Order Protect Against Slippage?
One of the most important misconceptions about risk management is that a stop-loss order guarantees an exit at the specified stop price.
In many conventional trading arrangements, a stop order becomes a market order once its trigger condition is met.
Suppose an investor owns a stock trading at $100 and sets a sell stop-loss at $95.
If unexpected news causes the stock to fall sharply and the next available execution price is $90, the resulting sale may occur near $90 rather than $95.
This is an example of gap risk and unfavorable execution.
A stop-limit order can establish a minimum acceptable selling price, but it introduces another problem: the order might not execute if the market moves below the limit.
The SEC explicitly highlights this distinction in its explanation of stop and stop-limit orders.
Traders therefore face a fundamental trade-off between prioritizing an exit and controlling the execution price.
Slippage in Crypto: What Does Slippage Tolerance Mean?
Cryptocurrency traders may encounter an additional setting known as slippage tolerance, particularly when using decentralized exchanges.
Slippage tolerance defines the maximum permitted deterioration from the quoted execution terms before a transaction is rejected or reverted, depending on the platform.
For example, a trader may set a 1% slippage tolerance when exchanging tokens through a decentralized application.
If the actual exchange terms move beyond the permitted threshold before execution, the transaction may fail instead of proceeding at the worse price.
However, a tolerance setting does not necessarily eliminate the price impact already incorporated into the original quote.
On decentralized exchanges using automated market makers, larger trades can change the relative balance of tokens within liquidity pools, influencing the quoted exchange rate.
An excessively wide slippage tolerance can expose traders to unfavorable execution, while a very narrow tolerance may increase the likelihood of failed transactions. Network fees may still be incurred for certain failed blockchain transactions.
Why Slippage Matters for Long-Term Investors and Active Traders
For long-term investors, small occasional execution differences may have a limited effect compared with broader market movements over many years.
Nevertheless, slippage remains a real trading cost, especially when buying less liquid securities or executing large transactions.
For active traders, the impact can be more significant.
A strategy designed to capture small price movements may become unprofitable if its expected returns are repeatedly reduced by unfavorable execution.
Consider a hypothetical strategy with an average gross gain of $20 per successful trade.
If unfavorable slippage costs $5 on entry and another $5 on exit, half of that gross gain disappears before commissions and other expenses.
This is why a trading strategy that appears profitable in historical simulations may produce weaker live results if the backtest does not realistically account for spreads, slippage and execution constraints.
The frequency of trading also matters. Even relatively small execution differences can accumulate when hundreds of transactions are completed.
Final Thoughts: The Price on the Screen Is Not Always the Price You Pay
Slippage in trading is a normal consequence of how financial markets operate. Prices continually change, available liquidity is limited, and trading orders cannot always execute at the exact price displayed on a screen.
The most important influences are market liquidity, price volatility, order size and execution speed. Their effects can be observed across forex, stocks, cryptocurrencies and other financial instruments.
Although traders cannot eliminate every source of slippage, understanding order types, assessing market depth and monitoring execution quality can help reduce unnecessary costs.
The central lesson is simple: a displayed price is information, not necessarily an execution guarantee. Successful trading requires understanding not only where an asset is priced, but also the conditions under which a transaction can actually be completed.
Disclaimer: This article is provided for educational purposes only and does not constitute financial or investment advice. All numerical examples are hypothetical and exclude transaction fees unless otherwise stated.