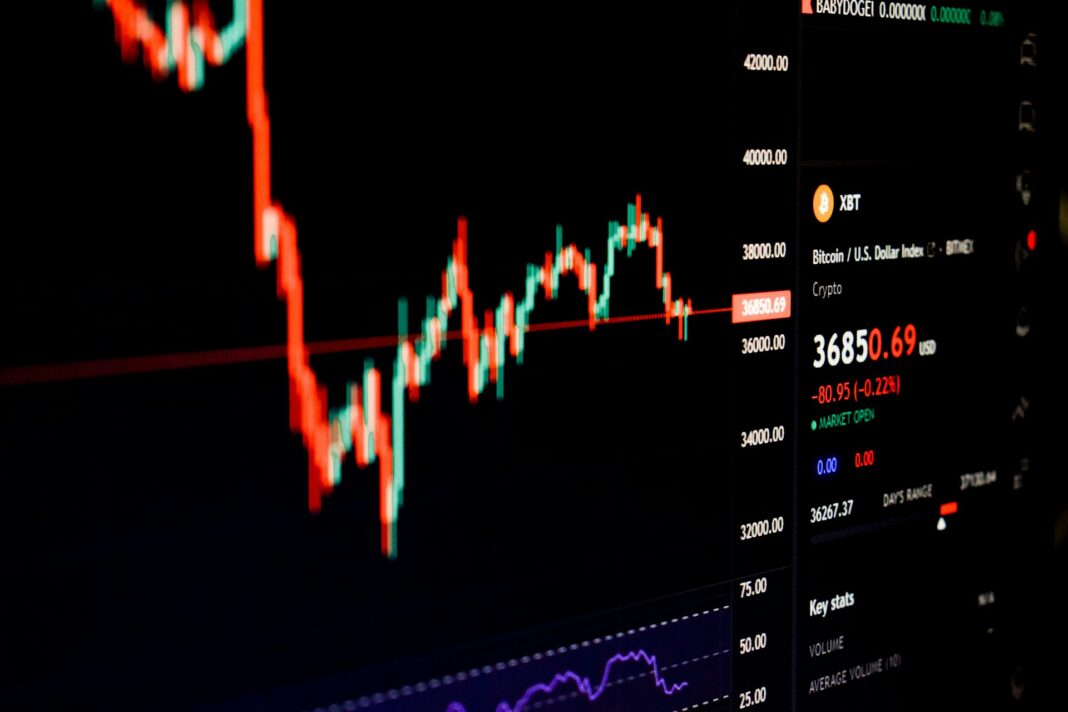



An engulfing candle is one of the most recognizable patterns in technical analysis. Formed by two consecutive candlesticks, it highlights a potential shift in buying and selling pressure. Depending on its direction and position within a price trend, the pattern may suggest that buyers are regaining control or that sellers are beginning to dominate the market. However, recognizing the formation is only the first step. Understanding its context, confirmation signals, and limitations is essential before drawing conclusions about future price movements.
What Is an Engulfing Candle?
An engulfing candle is part of a two-candlestick formation in which the body of the second candle completely covers the body of the preceding candle. The two candles move in opposite directions, reflecting a change in short-term price momentum.
The body of a candlestick represents the difference between its opening and closing prices. A green or bullish candle indicates that the price closed above its opening level, while a red or bearish candle shows that it closed below its opening level.
In an engulfing pattern, the second candle reverses the direction of the first and extends beyond its opening and closing prices. This suggests that the side initially driving the market has encountered stronger opposing pressure.
There are two main variations: bullish engulfing and bearish engulfing.
Although both patterns indicate a shift in market behavior, their interpretation depends heavily on the preceding trend. A bullish engulfing formation after a sustained decline may indicate a potential upward reversal, while a bearish engulfing formation following a rally can warn of weakening buying momentum.
The important distinction is that an engulfing pattern describes a completed price movement. It does not guarantee that the same direction will continue.
Read also: Best Sectors to Invest in 2026: 7 Industries Positioned for Structural Growth
Bullish Engulfing Candle: When Buyers Regain Control
A bullish engulfing pattern typically appears after a period of falling prices. It consists of a bearish candle followed by a larger bullish candle.
The first candle closes below its opening price, indicating that selling pressure remains present. The second candle then opens at or below the previous closing price and finishes at or above the previous opening price.
As a result, the green candle’s body completely covers the preceding red candle’s body.
Consider a hypothetical stock that has been declining for several sessions.
On the first day, the stock opens at $100 and closes at $97. Sellers maintain control throughout the session, producing a bearish candle.
The following day, the stock opens at $96 but attracts buying interest. By the closing bell, its price has recovered to $102.
The second candle has now engulfed the previous day’s body, creating a bullish engulfing pattern.
What makes this formation interesting is not simply the positive closing price. Buyers have managed to reverse the previous session’s net decline and push the market beyond its earlier opening level.
This can indicate that selling momentum is weakening and that market participants are willing to purchase the asset at higher prices.
However, a single bullish engulfing candle does not establish a new uptrend. If the broader market remains weak or the asset is approaching resistance, the recovery may prove temporary.
A subsequent move above the engulfing candle’s high may provide additional evidence that buyers are maintaining control.
Bearish Engulfing Candle: When Sellers Take Over
The bearish engulfing pattern represents the opposite situation. It usually develops after an upward price movement and may indicate that buying pressure is beginning to fade.
The formation starts with a bullish candle, showing that buyers have pushed prices higher. The following candle opens at or above the previous closing price but then falls sharply enough to close at or below the first candle’s opening price.
The resulting bearish candle engulfs the entire body of the preceding bullish candle.
Imagine a stock that has been rising steadily.
During the first session, it opens at $100 and closes at $103. The positive session reinforces expectations that the rally will continue.
On the next day, the stock opens at $104. However, sellers begin to dominate trading, driving the closing price down to $98.
The second candle completely covers the first candle’s body, producing a bearish engulfing formation.
This development suggests that buyers were unable to maintain the previous upward momentum. Sellers not only reversed the latest gains but pushed prices below the preceding session’s opening level.
A bearish engulfing pattern may be particularly relevant when it forms near an established resistance level or following an extended rally.
Nevertheless, it should not automatically be interpreted as the beginning of a sustained decline. Strong uptrends frequently experience temporary pullbacks before continuing higher.
For that reason, traders often look for additional weakness in subsequent sessions before treating the formation as a potential reversal.
Engulfing Candle Rules: What Actually Counts as a Valid Pattern?
Not every large candle following a smaller candle qualifies as a proper engulfing formation.
The defining characteristic is the relationship between the two candlestick bodies, rather than their total high-to-low trading ranges.
For a bullish engulfing pattern, the first candle must be bearish and the second bullish. Under a commonly used definition, the second candle opens at or below the first candle’s close and finishes at or above its opening price.
For a bearish engulfing pattern, the first candle must be bullish and the second bearish. The second candle opens at or above the first candle’s close and finishes at or below its opening price.
Some technical-analysis platforms apply stricter rules, requiring the second body to extend beyond both ends of the first rather than merely matching them. Traders should therefore establish a consistent definition when analyzing historical data.
Do candlestick shadows matter?
One common misconception is that an engulfing candle must cover the entire range of the previous session, including its upper and lower shadows.
That is not necessary.
The pattern is defined by the real bodies of the candles, representing their opening and closing prices. The shadows, or wicks, can extend beyond the engulfing candle without invalidating the formation.
This distinction also separates an engulfing pattern from an outside bar, which requires the second candle’s entire high-to-low range to exceed the first.
According to StockCharts ChartSchool, the opening and closing price relationship is central to recognizing engulfing formations.
The relative size of the candles also matters when interpreting the pattern. A substantially larger second body indicates a stronger net price movement against the previous session’s direction. However, that does not automatically translate into a higher probability of a successful reversal.
Why Market Context Matters More Than the Pattern Alone
An engulfing candle cannot be interpreted reliably without examining the surrounding price action.
The same two-candle formation may represent a possible trend reversal, a temporary correction, or ordinary market volatility.
Three factors are particularly important when evaluating its significance.
The preceding price trend
A bullish engulfing pattern carries a different interpretation after a prolonged decline than it does during an established uptrend.
Following a decline, the formation may suggest that buyers are challenging the prevailing selling pressure.
During an existing uptrend, however, the same pattern may simply indicate that a short-term pullback has ended.
Similarly, a bearish engulfing pattern after a substantial rally may warn of a potential reversal. In a broader downtrend, it may instead reflect renewed selling pressure after a temporary recovery.
Before analyzing an engulfing candle, traders should therefore determine whether the asset has been trending upward, downward, or moving sideways.
Support and resistance levels
The position of the pattern relative to important price levels can provide useful context.
A bullish engulfing formation near historical support may attract greater attention because the market is already approaching an area where buyers previously demonstrated interest.
A bearish engulfing formation near resistance may indicate that sellers are responding to a price level where upward movements have struggled in the past.
These levels are not guaranteed turning points. They simply provide a framework for evaluating the significance of the pattern.
Trading volume and volatility
Volume can help investors assess whether an engulfing formation occurred during relatively active trading.
An unusually high-volume bullish candle may suggest broad market participation in the recovery. Conversely, elevated activity during a bearish engulfing formation can accompany an aggressive sell-off.
However, trading volume alone cannot prove that a reversal will continue.
Volatility also matters. In highly volatile markets, large candles are more common, making engulfing formations less distinctive.
An engulfing candle that appears unusual on a stable daily chart may be relatively ordinary on a highly volatile cryptocurrency chart.
Read also: How to Invest $100K: A Framework Based on Time Horizon and Risk Capacity
How Traders Confirm an Engulfing Candle
Identifying an engulfing pattern is different from establishing that a lasting trend reversal has occurred.
The formation becomes complete only when the second candle closes. Before that point, an apparent engulfing candle can change substantially as prices fluctuate.
One approach is to observe whether subsequent price action supports the direction suggested by the formation.
For a bullish engulfing pattern, traders may look for a close above the engulfing candle’s high or a sequence of higher closing prices.
For a bearish engulfing pattern, a close below the engulfing candle’s low may provide additional evidence of selling pressure.
Some market participants also examine momentum indicators, moving averages, or nearby price levels.
For example, a bullish engulfing formation accompanied by improving momentum and a break above short-term resistance may offer more supporting evidence than an isolated green candle.
However, waiting for confirmation introduces a trade-off. The price may move significantly before an additional signal appears, reducing the potential reward relative to the risk.
There is no universally optimal confirmation rule. Its usefulness depends on the market, timeframe, and trading strategy.
Why Engulfing Patterns Sometimes Fail
Despite their popularity, engulfing candlestick patterns frequently fail to produce sustained reversals.
A bullish engulfing formation may appear during a falling market only for prices to resume declining several sessions later.
Similarly, a bearish engulfing candle may emerge during a powerful rally without interrupting the broader upward trend.
This happens because a candlestick describes historical price behavior rather than the future decisions of market participants.
An engulfing candle also does not directly reveal who placed orders or whether institutional investors were responsible for the movement. It illustrates the net result of buying and selling activity within the observed period.
Unexpected economic announcements, earnings releases, liquidity changes, and broader market conditions can quickly overwhelm a technical signal.
Another limitation involves trading costs and execution.
An investor who enters after a large engulfing candle may find that the distance to a reasonable stop-loss level is substantial. If the market subsequently reverses, losses may be significant relative to the expected gain.
Stop-loss orders also do not guarantee execution at the selected price, particularly when markets open with a price gap or experience sudden volatility.
For these reasons, a pattern that looks convincing on a historical chart may be much harder to trade profitably in practice.
How to Test an Engulfing Candle: A Small Sample Study
Rather than assuming that engulfing formations predict future prices, investors can evaluate their behavior using historical market data.
A simple sample study can help determine whether the pattern has provided useful information in a specific market.
The goal is not to prove that engulfing candles always work. Instead, the study should investigate whether price movements following the formation differ meaningfully from ordinary market behavior.
Step 1: Define the market and timeframe
Select one liquid instrument, such as a major stock index ETF, and examine at least two years of daily candlestick data.
Use the same timeframe throughout the study. Mixing daily, hourly, and weekly candles would make the results difficult to interpret consistently.
Step 2: Establish objective pattern rules
Identify bullish and bearish engulfing formations using the opening and closing prices of consecutive candles.
Exclude doji candles, where the opening and closing prices are equal, and require the second candle’s body to strictly exceed both ends of the first candle’s body.
To establish the preceding trend without using information from the formation itself, compare the closing price two sessions before completion with the closing price seven sessions before completion.
A lower price indicates a preceding five-session decline, while a higher price indicates a preceding advance.
Apply the same rules to every observation.
Step 3: Measure what happens afterward
Record the asset’s closing price on the day the engulfing candle completes and again five trading sessions later.
Calculate the subsequent percentage return using:
Five-day return (%) = [(Closing price after five sessions / Closing price on pattern day) − 1] × 100
For bullish patterns, a positive return supports the anticipated direction. For bearish patterns, a negative return supports it.
This definition measures directional follow-through, not the profitability of a particular trading strategy.
Step 4: Record the observations
Use the following template to collect the results.
| Date | Pattern | Prior trend | Price context | Return after 5 sessions | Expected direction? |
|---|---|---|---|---|---|
| DD/MM/YYYY | Bullish | Downtrend | Near support | +X.X% | Yes/No |
| DD/MM/YYYY | Bearish | Uptrend | Near resistance | −X.X% | Yes/No |
| DD/MM/YYYY | Bullish | Downtrend | No clear support | −X.X% | Yes/No |
The entries above illustrate how to fill in the template. They are not actual historical observations.
Aim to collect at least 50 qualifying observations for each pattern type where sufficient data are available. Smaller samples can be useful for learning, but they provide limited evidence about reliability.
Step 5: Compare the results with a baseline
Count how often the market moved in the expected direction after each formation. Then calculate the average and median five-session returns.
For example, if 30 out of 50 bullish engulfing formations were followed by higher prices, the observed directional success rate would be 60%.
That figure alone would not establish a predictive advantage.
The study should also examine how frequently the same market rose over five sessions after comparable declines, regardless of whether an engulfing candle appeared.
For bearish patterns, the relevant comparison is the frequency and magnitude of subsequent declines following comparable advances.
This baseline helps distinguish the contribution of the pattern from ordinary market behavior.
Additional testing should consider transaction costs, overlapping signals, different market regimes, and whether the findings remain consistent in a later period not used to develop the rules.
Most importantly, avoid changing the criteria after seeing the results. Doing so risks selecting rules that fit historical data but fail in future trading.
Engulfing Candle vs. Other Candlestick Patterns
Engulfing formations are sometimes confused with related candlestick patterns, particularly the harami and piercing patterns.
A harami consists of a relatively large first candle followed by a smaller candle whose body sits inside the previous body. This is essentially the opposite body relationship to an engulfing pattern.
A bullish piercing pattern also involves a bearish candle followed by a bullish candle. However, the second candle closes above the midpoint of the first candle’s body without necessarily exceeding its opening price.
The bearish counterpart, known as a dark cloud cover, follows a similar principle in the opposite direction.
Understanding these differences matters when applying technical indicators or comparing historical studies. Two analysts can obtain different results simply because they use different rules to classify candlestick formations.
Is an Engulfing Candle a Reliable Trading Signal?
An engulfing candle provides a useful way to visualize a change in short-term price control. Its main advantage is simplicity: traders can recognize when the latest candle has reversed and exceeded the previous candle’s body.
However, simplicity should not be confused with predictive certainty.
The formation becomes more informative when evaluated alongside the preceding trend, support and resistance levels, volatility, trading volume, and subsequent price action.
Even then, no single candlestick pattern can reliably predict market direction in every environment.
Investors should distinguish between recognizing a potential reversal and demonstrating that a trading strategy based on that signal has a measurable advantage.
The most practical approach is to treat engulfing formations as a starting point for analysis rather than as independent instructions to buy or sell.
Conclusion: An Engulfing Candle Shows a Shift, Not a Guarantee
The engulfing candle illustrates an important feature of financial markets: buying and selling pressure can change rapidly, sometimes within a single trading session.
A bullish engulfing pattern shows that buyers have reversed the previous candle’s downward movement, while a bearish engulfing pattern indicates that sellers have overcome the preceding upward movement.
Both formations can highlight moments when the prevailing short-term trend is being challenged.
However, their significance depends on where they appear and what happens next. A large engulfing candle without supporting context may be no more meaningful than an ordinary volatile session.
For investors and traders, understanding the pattern’s structure is useful. Testing its historical performance under clearly defined conditions is even more valuable.
Ultimately, an engulfing candle is evidence of a completed shift in price momentum, not proof that a lasting trend reversal has begun.