
If you are searching for a detailed Solonix review or want to know what the Research Terminal available through Solonix.one looks like, this review provides a closer look at the platform based on its current interface and available research tools.
The Solonix research application shown here is designed around a professional, terminal-style workspace. Rather than presenting users with a simplified market dashboard, the platform brings together global market information, individual security research, financial statements, market movers, dividend data, ratio charts and additional market-monitoring tools within one interface.
For traders and investors comparing research solutions, the key question is whether Solonix.one provides enough market information in a practical format. The research environment appears to place considerable emphasis on information density, quick navigation and access to both macro and company-specific data.
Solonix.one Research Terminal Overview
The first thing that stands out in the Solonix research platform is its desktop-terminal design.
The application uses a dark interface with a persistent navigation menu on the left and a large central workspace. This approach will be familiar to users of professional financial terminals and market-analysis software.
The main global research menu visible in the platform includes:
- World Clock
- Dividend Calendar
- Market Holidays
- Movers
- News
- Economic Calendar
- Ratio Chart
- Watchlist
- Swap Calculator
- Exchanges
- Currencies
- FX Converter
- Daily Briefing
Once a specific security is loaded, Solonix provides a separate set of company-focused research sections, including Overview, Financials, Price Chart, Dividends, Earnings, Market News, AI Market Overview, MyNotes and Historical Prices.
This combination gives the platform a clear separation between global market research and individual instrument analysis.
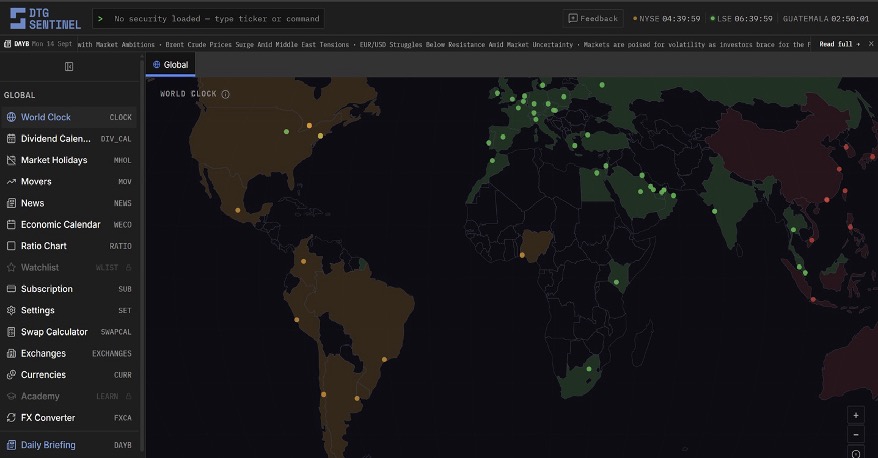
World Clock and Global Market View
One of the more visually distinctive features shown in the Solonix application is its World Clock.
Instead of simply displaying a list of exchange opening hours, Solonix presents the information on a world map. Different regions and market locations are visually marked, allowing users to get a quick overview of trading activity across international markets.
The header also displays clocks for major trading locations and exchanges.
For traders operating across several regions, this type of interface can be particularly useful because market sessions can be understood visually rather than by repeatedly checking separate exchange schedules.
The global-market approach is consistent with the overall design philosophy of the Solonix research application: keeping multiple pieces of relevant market information accessible from one environment.
Ratio Chart
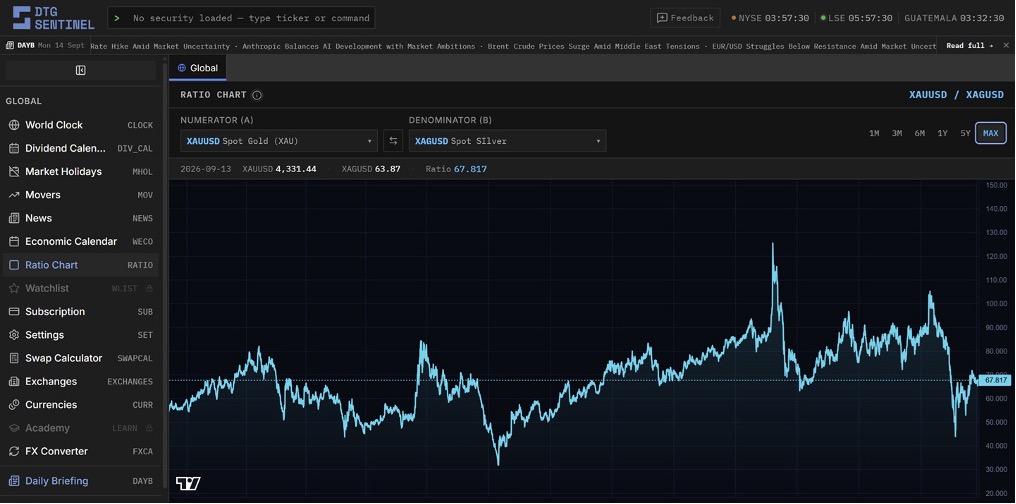
Another notable tool visible during our Solonix review is the Ratio Chart.
The example shown compares XAUUSD – Spot Gold against XAGUSD – Spot Silver. The system then calculates and charts the relationship between the two instruments over time.
In the example interface, users can switch between multiple time periods, including shorter-term ranges and a maximum historical view.
Ratio analysis can be useful for traders looking at relative valuation or relationships between correlated assets. Gold-to-silver is a well-known example, but the presence of separate numerator and denominator selectors suggests that the feature is designed around comparing different instruments rather than displaying only a predefined chart.
For a research-focused platform, this is a valuable addition because it extends analysis beyond conventional single-asset price charts.
Market Movers
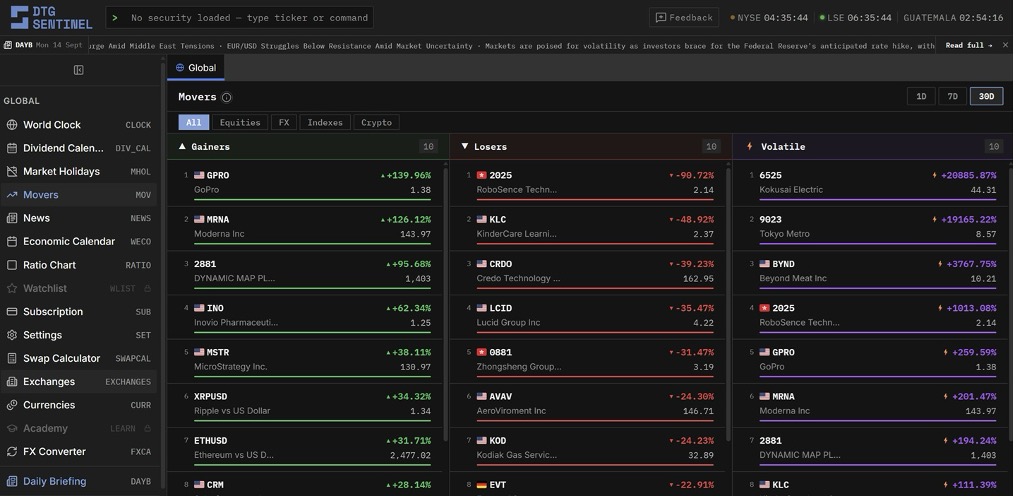
The Movers section provides a fast overview of significant market activity.
The interface separates securities into three main categories: Gainers, Losers and Volatile instruments.
Users can also filter the market view by categories such as equities, FX, indices and crypto, while multiple time periods are available.
Each result displays key information such as the ticker, company or instrument name, current value and percentage movement.
This is one of the stronger features from a usability perspective. Instead of requiring the user to manually scan watchlists for unusual activity, the Solonix platform brings notable price movements into a dedicated dashboard.
For active traders, market-mover screens can be useful for generating research ideas and identifying instruments experiencing unusually strong market activity.
Dividend Calendar
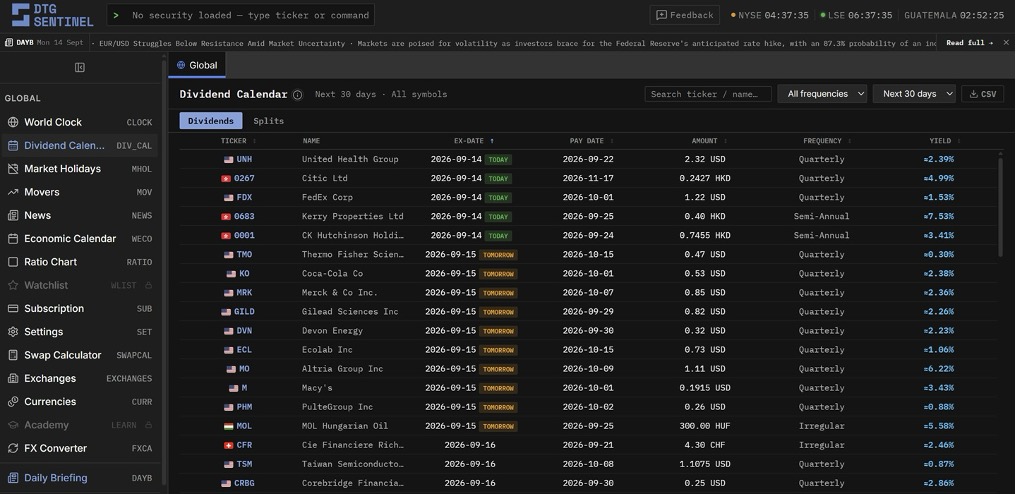
Income-focused investors are also provided with a dedicated Dividend Calendar.
The dividend screen displays information including ticker, company name, ex-dividend date, payment date, dividend amount, frequency and indicated yield.
The calendar can also be filtered, while a search field enables users to look for individual companies or symbols.
The screenshot shows both upcoming and current ex-dividend events, with labels such as “Today” and “Tomorrow” helping highlight near-term dates.
There is also a separate section for stock splits.
For investors managing dividend portfolios, bringing ex-dividend dates, payment dates and yields together in one table can significantly reduce the amount of manual research required across individual company pages.
Individual Stock Research
A major part of this Solonix.one review is the platform’s security-specific research interface.
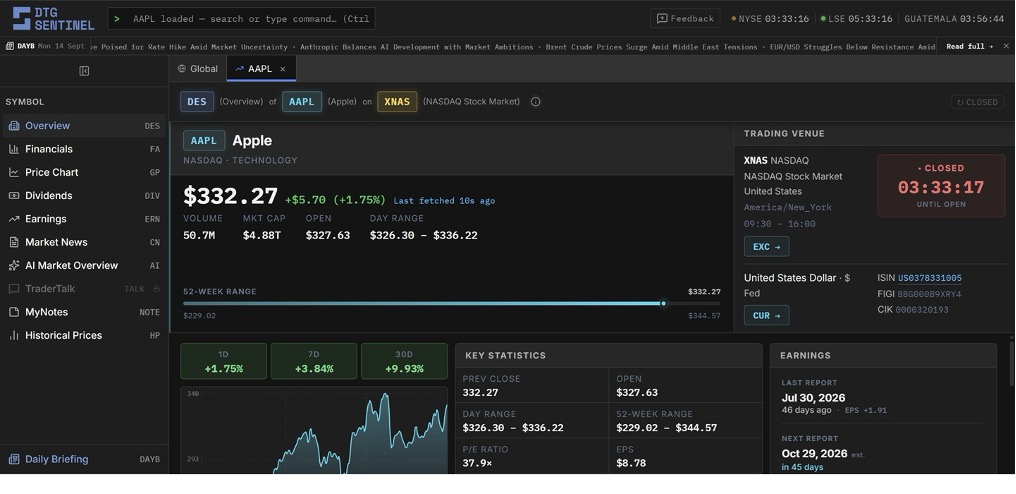
The Apple (AAPL) example provides a useful illustration of how an individual equity is presented.
After loading the ticker, Solonix displays a dedicated workspace containing the company name, exchange, industry and current market information.
The overview shown includes metrics such as current share price, daily price change, trading volume, market capitalization, opening price, daily trading range and 52-week range.
A separate Key Statistics section displays additional valuation and earnings information, while the page also contains a recent price chart.
This layout means that a considerable amount of information can be viewed without moving between multiple browser tabs or websites.
Earnings Information
The individual stock overview also includes an Earnings panel.
The example displays both the company’s previous report and an estimated date for the next earnings release.
For investors following individual equities, placing earnings timing directly next to price and valuation information is useful because upcoming earnings announcements can have a significant influence on market volatility.
The platform therefore combines price monitoring and fundamental-event tracking on the same screen.
Financial Statements
The Financials section goes considerably deeper than the basic company overview.
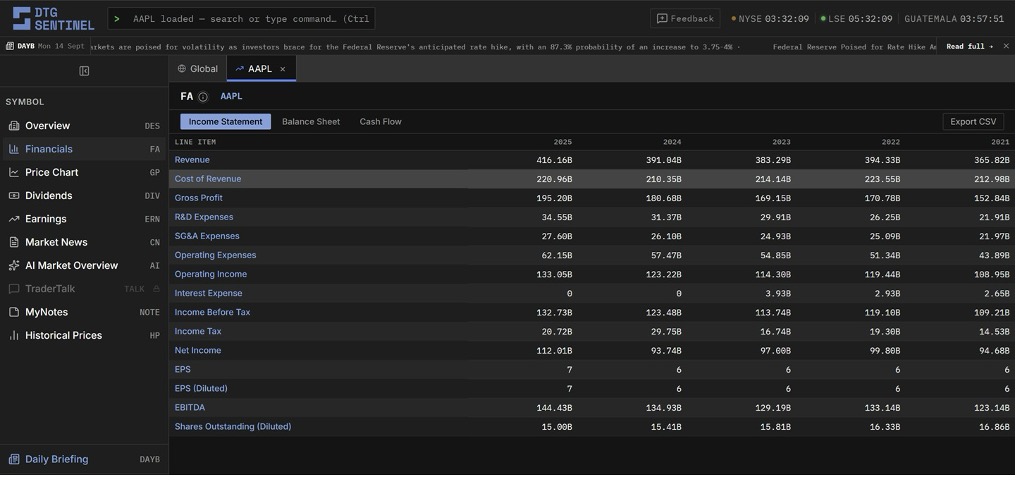
Users can switch among Income Statement, Balance Sheet and Cash Flow.
The income-statement example shown for Apple provides multiple years of historical financial information.
Visible line items include revenue, cost of revenue, gross profit, R&D expenses, SG&A expenses, operating expenses, operating income, interest expense, pre-tax income, income tax, net income, EPS, diluted EPS, EBITDA and diluted shares outstanding.
Displaying several years side by side makes it easier to identify longer-term trends in revenue, profitability and expenses.
This is an important component of the Solonix research offering because it makes the platform relevant not only to short-term traders but also to investors performing fundamental company analysis.
Historical Fundamental Analysis
One of the advantages of the financial-statement layout is the ability to compare company performance across consecutive reporting periods.
For example, investors can use the table to examine whether revenue is expanding, operating expenses are increasing faster than sales, margins are improving, net income is rising, or the number of outstanding shares is changing.
This makes Solonix more than a simple price-monitoring dashboard.
The research interface shown in this Solonix review combines market prices with fundamental information that can support a broader investment-research workflow.
Solonix Research Terminal Interface and User Experience
From a visual perspective, Solonix clearly targets users who prefer a professional financial-terminal aesthetic.
The interface is information-dense but logically divided.
Navigation remains consistently positioned on the left, while active research modules open in the larger central workspace. Tabs at the top make it possible to distinguish between the global dashboard and an individual loaded security.
Colors are also used selectively. Positive market movements are generally represented in green, declines in red, volatility-related information in purple, while blue is used for selected interface elements.
The result is a dashboard that can display substantial amounts of data while retaining a relatively consistent visual hierarchy.
Users accustomed to minimalist mobile investing apps may initially find the amount of information substantial. More experienced investors and active traders, however, may appreciate having more data visible at the same time.
Global Research and Single-Security Analysis in One Platform
One of the most interesting characteristics of the Solonix.one research platform is the combination of macro and micro-level research.
The global dashboard covers topics such as exchange activity, economic events, currencies, market movers and dividends.
Loading an individual stock then changes the research workflow toward company-specific information such as financial statements, earnings, historical prices and related market news.
That structure potentially reduces the need to use several separate research websites.
A trader could begin by identifying an unusual mover, open the corresponding security, inspect its chart and company information and then move into financial statements or earnings data.
That is a sensible workflow for a modern research platform.
Who Could Find Solonix Research Terminal Useful?
Based on the features visible during this Solonix review, the research platform appears particularly relevant to users who want more information than a basic broker dashboard normally provides.
Active traders may be most interested in the Movers, market clocks, news, economic calendar and price-analysis functions.
Longer-term equity investors can make use of company financial statements, dividend information, earnings schedules and historical data.
Multi-asset traders may also benefit from features such as currencies, FX conversion and the Ratio Chart.
The breadth of tools therefore appears to be one of the main strengths of the Solonix research interface.
Solonix Research Terminal Review: Main Advantages
- Comprehensive research dashboard: Solonix combines global markets, company analysis, financial information and event calendars in a single interface.
- Detailed stock research: Individual security pages provide market data, statistics, earnings information and multiple additional research categories.
- Historical financial statements: Multi-year income statement, balance-sheet and cash-flow sections support fundamental analysis.
- Useful market discovery tools: The Movers dashboard can help users identify gainers, losers and unusually volatile instruments.
- Dividend research: Ex-dividend dates, payment dates, dividend amounts and yields are collected in a structured calendar.
- Cross-asset analysis: The Ratio Chart provides an additional method for analyzing relationships between financial instruments.
- Professional interface: The terminal-like layout is designed to accommodate substantial amounts of financial information without forcing users into a highly simplified dashboard.
Potential Considerations
A balanced Solonix.one review should also distinguish between what can be evaluated from the interface and what cannot.
The screenshots demonstrate the scope and design of the research application, but they do not establish factors such as real-time data latency, the complete universe of supported markets, subscription conditions or the exact methodology used for individual data points.
Those factors should be evaluated separately by anyone considering the service for their own trading or investment process.
The interface is also relatively data-heavy. That is likely to appeal to experienced market participants but could require some adjustment for users who are completely new to financial research platforms.
Solonix Research Terminal Review 2026: Final Verdict
Solonix.one offers a broad, terminal-style market research environment with a strong emphasis on bringing multiple forms of financial information into one workspace.
The combination of global market monitoring, market movers, dividend calendars, ratio analysis, company overviews, earnings information and multi-year financial statements makes the platform appear significantly more research-oriented than a basic brokerage dashboard.
The strongest aspect of the Solonix platform is arguably the way these tools are integrated. A user can move from a global overview to a specific security and then continue into fundamental data without leaving the main research environment.
For traders and investors researching Solonix, the screenshots indicate that Solonix.one has invested heavily in building a comprehensive market-analysis interface rather than providing only simple price quotes and charts.
For that reason, users searching for a Solonix review or Solonix.one review should view the research platform as one of the more important parts of the overall Solonix offering to examine.
Solonix Research Terminal Review FAQ
What is Solonix Research Terminal?
Solonix Research Terminal is associated with the Solonix.one platform. The research application reviewed here provides access to market-monitoring and investment-research tools covering global markets and individual securities.
What research tools are available on Solonix Research Terminal?
The interface reviewed includes tools such as a World Clock, Dividend Calendar, Market Holidays, Movers, News, Economic Calendar, Ratio Chart, Swap Calculator, Exchanges, Currencies, FX Converter and Daily Briefing.
Does Solonix Research Terminal provide stock research?
Yes. The Solonix research interface shown in this review includes individual stock pages containing price information, market statistics, earnings information, financial statements, historical prices, dividends and related research sections.
Does Solonix Research Terminal provide company financial statements?
The platform screenshots show Income Statement, Balance Sheet and Cash Flow sections. The financial data can be viewed across multiple reporting years, making it possible to compare historical company performance.
Does Solonix Research Terminal have a dividend calendar?
Yes. The Solonix Dividend Calendar displays ex-dividend dates, payment dates, dividend amounts, payment frequency and indicative dividend yields.
Can Solonix Research Terminal show market gainers and losers?
Yes. The Movers section separates instruments into Gainers, Losers and Volatile categories and provides filters for different asset classes and time periods.
Does Solonix Research Terminal include fundamental analysis?
The company Financials section provides historical fundamental information including revenue, gross profit, operating expenses, operating income, net income, EPS and EBITDA, together with Balance Sheet and Cash Flow sections.
Is Solonix.one Research Terminal suitable for active traders?
The combination of market movers, market clocks, news, economic-calendar information and security-specific research could make the platform useful to active traders. Suitability ultimately depends on an individual trader’s strategy and requirements.
Is Solonix.one Research Terminal suitable for long-term investors?
The presence of financial statements, dividend information, earnings dates, historical prices and company statistics provides several tools relevant to longer-term fundamental research.